
OP17 Case Mapping Calculator
Set your case count, click each opened box, and tick what it held. Everything recalculates live. The Odds / sealed box column is the chance a box you have not opened yet holds at least one of that hit, given what is already gone from the case.
Click a box to open it, then tick what it held. Boxes you leave untouched are still sealed — the odds below are for those.
Select a box above to record its hits.
| Hit type | Odds / sealed box | Expected total | Found | Left in case | Avg / box |
|---|---|---|---|---|---|
| Alt-Art LeaderReliable | 29%base 29% | 4 | 0 | 4 | 0.3 |
| Secret Rare (SEC)Reliable | 35%base 35% | 5 | 0 | 5 | 0.4 |
| Alt Art / ParallelReliable | 58%base 58% | 10 | 0 | 10 | 0.8 |
| Gold DON!!Reliable | 8.3%base 8.3% | 1 | 0 | 1 | 0.1 |
| Panda Man Alt ArtReliable | 46%base 46% | 7 | 0 | 7 | 0.6 |
| Platinum (Diamond) DON!!Lottery | 8.3%base 8.3% | 1 | 0 | 1 | 0.1 |
| Gold Special Art (SP)Lottery | 16%base 16% | 2 | 0 | 2 | 0.2 |
| Treasure Rare (TR)Lottery | 8.3%base 8.3% | 1 | 0 | 1 | 0.1 |
| Manga Special ArtLottery | 4.3%base 4.3% | 0.5 | 0 | 0.5 | 0 |
| Pirates Crew Alt Art (grail)Lottery | 2.6%base 2.6% | 0.3 | 0 | 0.3 | 0 |
Estimates only. OP17 has no fixed hit map — hits land 1–4 per box at random, so a case yields these counts on average with heavy variance. Odds treat the per-case totals as a soft pool spread across the sealed boxes; a real case can over- or under-shoot. Not affiliated with Bandai.
One Piece Case Mapping Explained
Case mapping is working out what is inside the sealed booster boxes of a One Piece case from what has already come out of it. A sealed case holds 12 boxes (288 packs). If a case reliably contains a fixed number of each hit, then every hit someone pulls removes one from that pool — and the boxes still on the shelf become measurably better or worse bets. That is the entire idea, and it is why you see people at a shop counting what has already been opened before choosing a box.
The confusing part is that “case mapping” is used for three different things, and only one of them still works on current sets:
- Hard mapping — a literal box-by-box chart: box 3 holds the SEC, box 7 holds the alt-art leader. This only exists when Bandai fixes both the count and the position of hits. This is what most people picture, and it is the version that is dead on modern sets.
- Box-count mapping — no fixed positions, but a dependable number of hits per box (“every box has a Secret Rare or an alt art”). Weaker, but it still lets you say what a box is worth before it is opened.
- Case-budget mapping — treat the per-case totals as a pool, subtract everything already pulled, and spread the remainder across the sealed boxes. No chart, just conditional odds that move as the case empties. This is the only version that still works, and it is what the calculator above does.
Why Case Maps Used to Work — and What Broke Them
Case maps were never a leak or a secret. They came out of collation: hits are printed on a sheet in a repeating order and packs are collated in that order, so cases came off the line carrying the same pattern. Openers logged full cases, saw the pattern repeat across cases from the same print run, and published it. On top of the case-level pattern, two in-box tells made mapping usable pack by pack:
- Consistent hit positions. Hits sat in the same slots inside the 24-pack box, so a pack’s position in the row was itself information.
- Dead packs. In sets before OP16, the pack holding a leader card was a dead pack — it signalled that no other hit sat nearby. Finding the leader packs mapped the gaps between hits, which is why openers used them as landmarks.
Both tells have since been removed, in two steps. OP16 killed the dead pack: leader packs can now also contain a Super Rare, so a leader no longer rules anything out. Then OP17 dropped fixed hit mapping altogether — the premium hits (alt arts, SEC, Gold SPs, mangas, and the Gold and Platinum DON!!) are distributed randomly, so one box can deliver four hits while the next delivers one. Any “OP17 case map” chart you find online is either from an older set or made up.
Which One Piece Sets Are Still Mappable
| Era | What was mappable | Reliable tell | Hard map? |
|---|---|---|---|
| Through OP15 | Fixed hit count and position per box — the classic community case map | Leader pack = dead pack; hits in consistent slots | Yes |
| OP16 | Box and case counts still stable (English cases held ~8 SECs — 2 of each of the 4), but pack-level position reading broke | None — leader packs can now hold an SR too | No |
| OP17 onward | Case averages only — ~22 hits, 4 alt-art leaders, ~5 SEC, ~2 special DON!! per 12-box case | None — hits land 1–4 per box at random | No |
Japanese and English print runs also collate differently — OP16 English cases carried roughly twice the Secret Rares of Japanese cases — so a map sourced from one region never transfers cleanly to the other.
How to Map a One Piece Case Today (Step by Step)
With no fixed chart to read, mapping is now arithmetic on a depleting pool. This is the method the calculator above automates, and it works on any set once you know its per-case averages:
- Start from the case budget, not the box. Look up the per-case average for each hit type — for OP17 that is 4 alt-art leaders, ~5 SEC, ~10 alt art/parallel, ~7 Panda Man and ~2 special DON!!. Multiply by the number of cases in play.
- Count what is already gone. Every box that has been opened out of that case, and every hit pulled from it, comes off the pool. At a shop, this is the question worth asking: how many boxes are out, and what came out of them?
- Spread the remainder across the sealed boxes. Remaining hits ÷ remaining boxes gives the expected count per sealed box; from there, the chance a given box holds at least one.
- Compare against the base rate. If the conditional odds sit above the flat per-box rate, the shelf is favourable — the case still owes you hits. If they sit below, the good boxes are probably already gone.
- Watch the lottery tier separately. A hit that averages one per case (the Platinum DON!!) swings hardest: untouched, a box is only about an 8% shot, but with nine boxes gone and no Platinum recorded, the remaining three carry it between them.
- Do not over-trust the number. Without a fixed map, a real case can over- or under-shoot its averages. Rising odds mean a better bet, not a promise.
The practical upshot: you can still map a case, but you are mapping probability, not positions. Anyone selling “mapped” boxes from a current set as a guarantee is selling you the old model of a game that no longer works that way.
Does OP17 Have a Case Map?
Not a fixed one — and that is the single most important thing to understand before you try to “map” an OP17 case. OP17 removed the fixed hit mapping that made the old box-by-box charts possible. The premium hits — alt arts, Secret Rares, Gold SPs, mangas, and the Gold and Platinum (Diamond) DON!! — are distributed randomly, so one box can deliver four hits while the next delivers one.
What survives is the case-level average. Across 1,000+ packs (three full cases plus additional boxes), a case reliably converges on the budget in the table below. That is why “case mapping” for OP17 is really conditional odds, not a fixed chart: as boxes come out of a case, the remaining hits have fewer boxes to hide in, so the odds on each sealed box shift. The calculator models exactly that.
Average Pulls Per Case (All the Usual Hits)
These are the same community aggregates behind our OP17 pull rates page, expressed as a per-case budget. The Reliable tier shows up in essentially every case; the Lottery tier is a genuine chase that can skip a case entirely.
| Hit Type | Avg / Case | Tier | Notes |
|---|---|---|---|
| Alt-Art Leader | 4 per case | Reliable | Kaido, Shanks, Charlotte Linlin, Edward Newgate — the reliable premium tier, roughly one per 3 boxes. |
| Secret Rare (SEC) | 5 per case | Reliable | Loki SEC dominates — one case produced five different Lokis. About one per 2–3 boxes. |
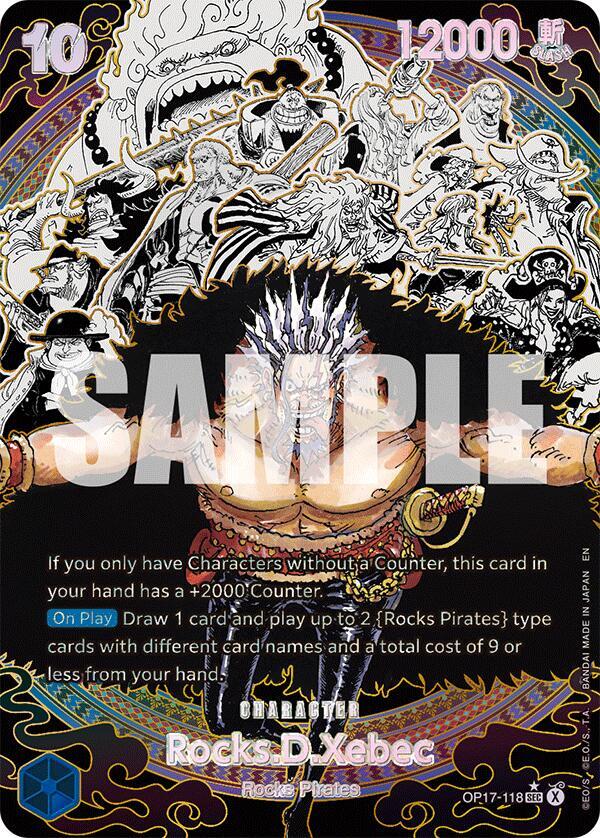
| Alt Art / Parallel | 10 per case | Reliable | The mid-tier chases most openers walk away with — Nico Robin, Rocks, Beckman, recurring Loki. 0–3 per box. |
| Gold DON!! | 1 per case | Reliable | Premium gold DON!! finish; a case typically holds one Gold plus one Platinum. |
| Panda Man Alt Art | 7 per case | Reliable | Six star-stamped 2K vanilla secrets; ~6–8 per case but NOT one-per-box — some boxes had none, some two. ~$2 each. |
| Platinum (Diamond) DON!! | 1 per case | Lottery | The Diamond DON!! — ~$850 at pre-release and roughly one per case. The case-opening showstopper. |
| Gold Special Art (SP) | 2 per case | Lottery | Gold hockey SPs (D. Roger, Yamato, Buggy, Shanks); ~2 per case, but one full case missed its second entirely. |
| Treasure Rare (TR) | 1 per case | Lottery | A genuinely playable Edward Newgate TR; ~1 per case and not guaranteed. |
| Manga Special Art | ~0.5 per case | Lottery | Four Emperors mangas (Whitebeard, Big Mom, Kaido, Shanks) — the rarest tier, skips most cases entirely. |
| Pirates Crew Alt Art (grail) | ~0.3 per case | Lottery | The Luffy / Rocks grail — ~$6,000 in Japan. Most full cases in the sample did NOT contain one. |
Totals are averages with heavy variance — a full case landed roughly 16 hits + 6 DON!! ≈ 22, or about 30 counting Panda Man. The manga specials, Gold hockey SPs, Treasure Rare and the Pirates Crew grail are not guaranteed in any given case.
How the Odds Are Calculated
The model is deliberately simple and honest. For each hit type it takes the per-case average (for example, 4 alt-art leaders), multiplies by your number of cases, and subtracts everything you have already recorded to get the hits left in the case. Those remaining hits are then spread across the boxes you have not opened, and the tool reports the chance a given sealed box holds at least one.
- Odds / sealed box — the conditional chance for a box you have not opened yet, after accounting for what is gone.
- base (grey) — the flat rate you would expect from a fresh, untouched box if hits were purely random. Compare the two to see how much the opened boxes have moved your odds.
- Avg / box — expected number of that hit still sitting in each sealed box.
Two honest caveats. First, because OP17 has no fixed map, these are estimates around a case average — a real case can over- or under-shoot, so treat a rising number as “better odds,” not a guarantee. Second, once you have recorded as many of a hit as the case averages, the pool shows as exhausted — but a lucky case can still overspill, which is genuine bonus territory rather than an impossibility.
Frequently Asked Questions
What is case mapping in the One Piece Card Game?
Case mapping is working out what is inside the sealed boxes of a case from what has already come out of it. A case is 12 boxes / 288 packs; when the hits per case are fixed, every hit pulled removes one from the pool and shifts the odds on the boxes still on the shelf. The term covers hard mapping (a fixed box-by-box chart), box-count mapping (a guaranteed number of hits per box, no fixed position) and case-budget mapping (a depleting pool of case averages). Only the last still works on current sets.
How does One Piece case mapping work?
It worked on collation — hits are printed and packed in a repeating order, so cases from the same run carried the same pattern, which openers logged and published. Two in-box tells made it readable pack by pack: hits sat in consistent slots, and a leader pack was a dead pack that signalled no other hit nearby. Today only the case-level method survives: take the per-case averages, subtract what has been pulled, and spread the rest across the sealed boxes.
Does One Piece case mapping still work in 2026?
Not as a hard chart. OP16 removed the dead-pack tell — leader packs can now hold a Super Rare too. OP17 then dropped fixed hit mapping outright, so hits land 1–4 per box at random. What survives is the case average (~22 hits, 4 alt-art leaders, ~5 SEC, ~2 special DON!! per case), which is what the calculator on this page models. Any box-by-box “OP17 case map” chart is either from an older set or invented.
What is a dead pack in One Piece TCG?
A pack that cannot hold a premium hit. Before OP16, the pack containing a leader was reliably dead and signalled no other hit nearby — openers used leader packs as landmarks when mapping a box. OP16 ended that, so a leader now rules nothing out.
Does OP17 have a case map?
Not a fixed one. OP17 dropped the fixed hit mapping that older sets used, so hits land 1 to 4 per box at random. What holds is the case average — about 4 alt-art leaders, ~5 SEC, ~2 special DON!! and ~22 hits per 12-box case. The calculator uses those averages as a soft pool and recomputes each sealed box’s odds as you record what has been opened.
How does the OP17 case mapping calculator work?
Pick your case count, click each opened box, and tick what it held. The per-case totals are treated as a pool; every hit you record is subtracted, and the remainder is spread across your sealed boxes. Each box then shows the chance it holds at least one of a given hit, alongside the flat base rate for a random box.
What are the odds of a Diamond (Platinum) DON!! per box?
The Platinum DON!! — the Diamond DON!! — lands roughly once per case, so a single untouched box is about an 8% chance. If a case still has its Platinum DON!! unaccounted for and only a few sealed boxes remain, mark off the opened boxes and the per-box odds climb sharply.
How many hits are in an OP17 case?
A full case (12 boxes, 288 packs) averages about 22 hits — roughly 16 hits plus 6 DON!!, or about 30 counting Panda Man. That breaks down to ~4 alt-art leaders, ~5 SEC, ~10 alt-art/parallels, ~6–8 Panda Man, and ~2 special DON!!, with the mangas, Gold SPs, Treasure Rare and Pirates Crew grail as unguaranteed extras.
Disclaimer: All odds are estimates. OP17 has no fixed hit map — community aggregates (1,000+ packs across three cases) give per-case averages with heavy variance, and this tool models them as a soft pool spread across sealed boxes. Bandai does not publish official hit rates for One Piece TCG. This is not financial advice.